Disability Statistics
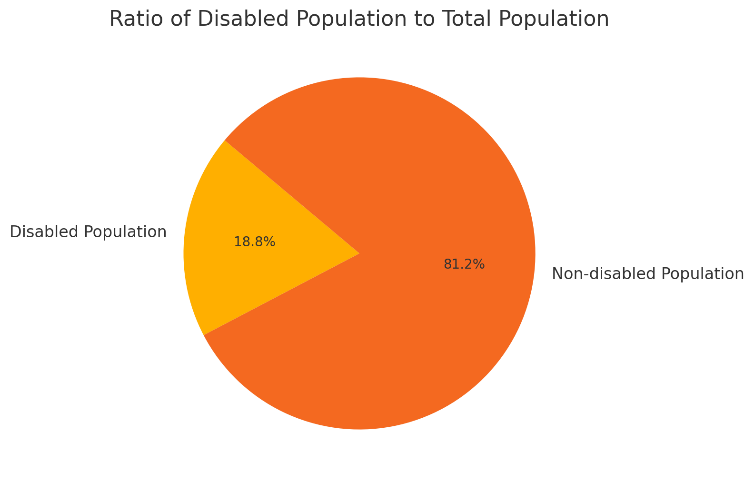
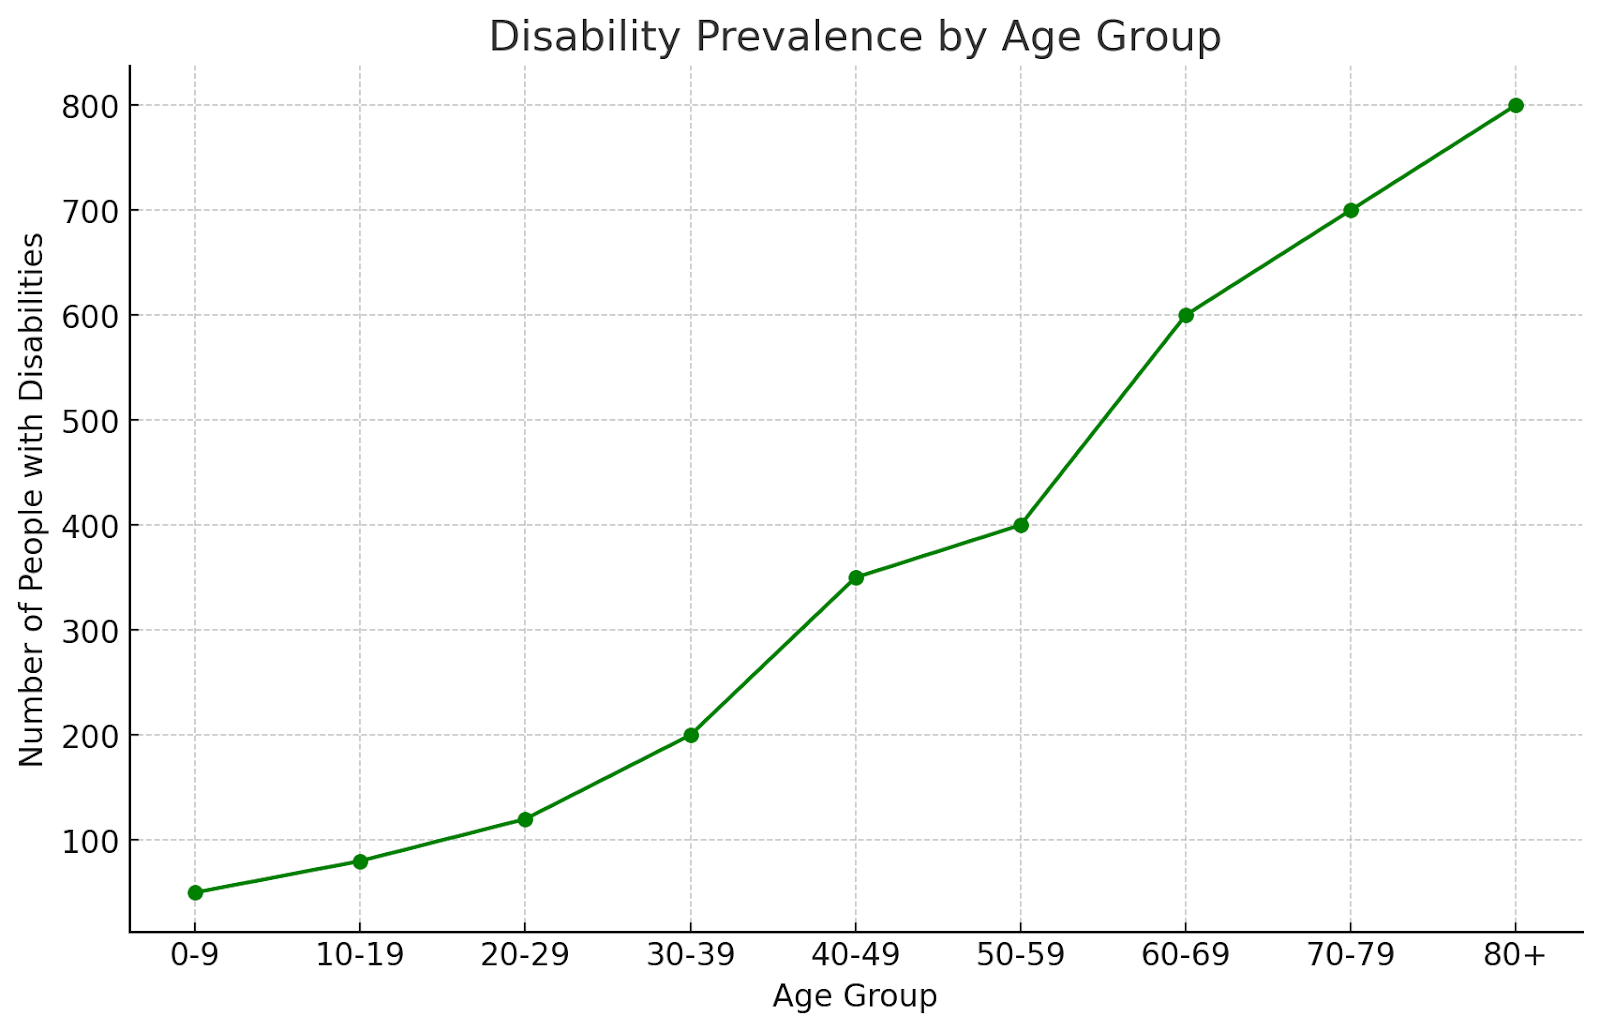
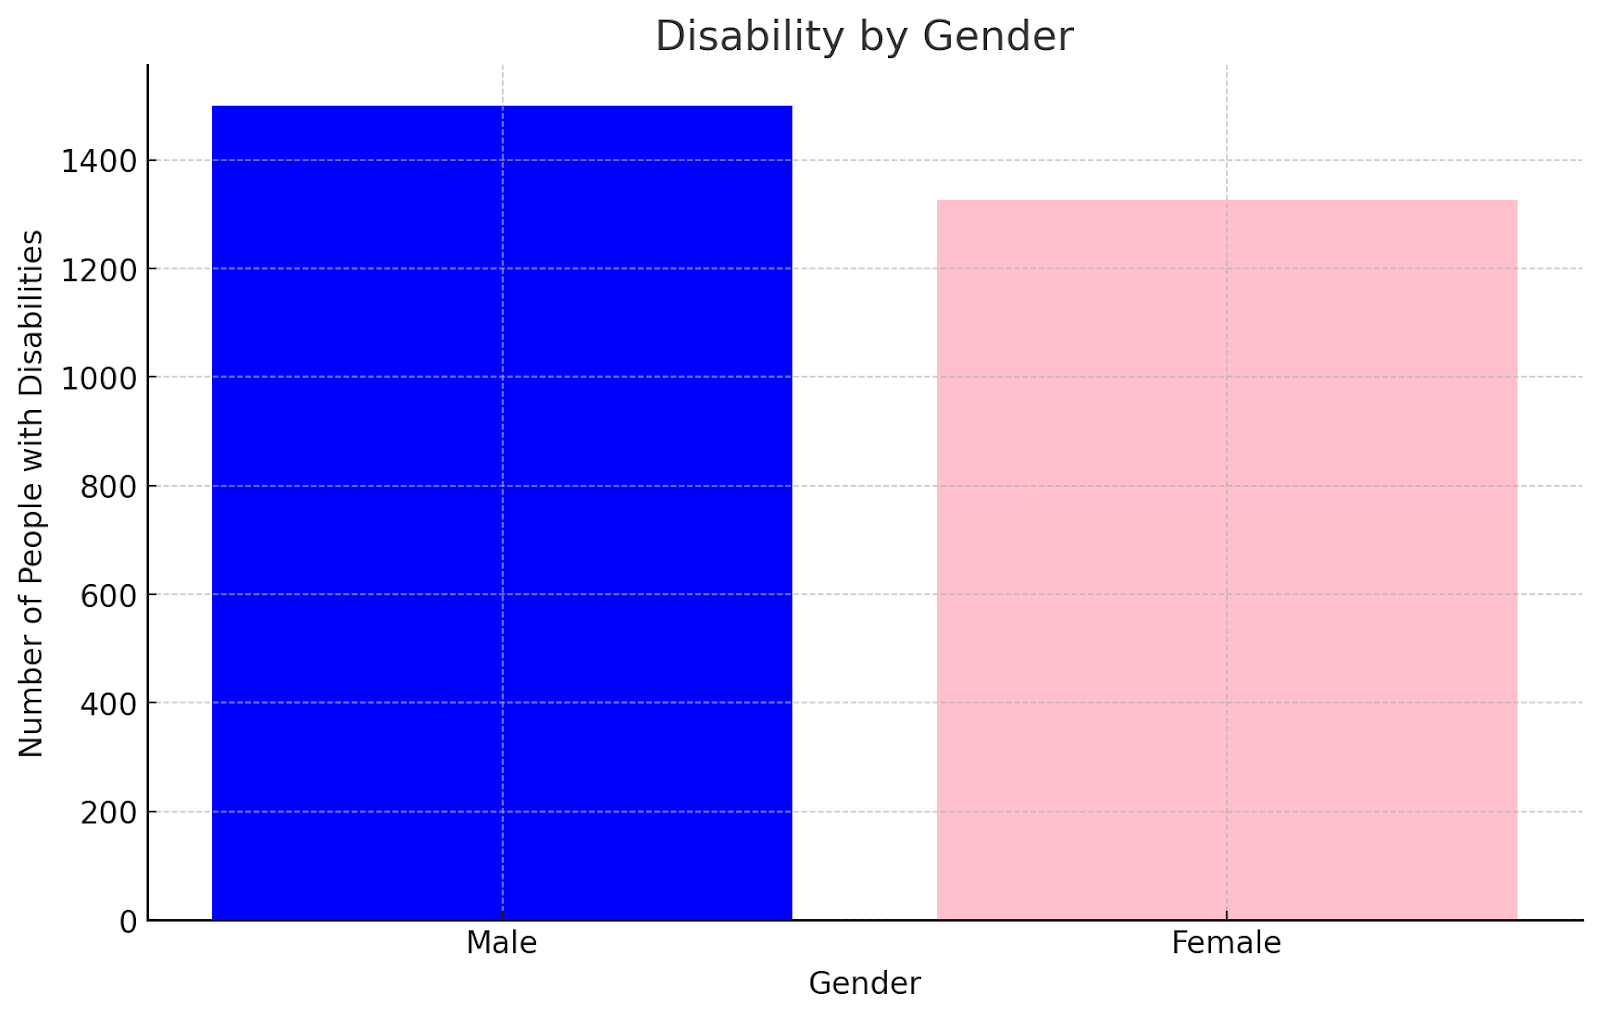
Key numbers and data about people with disabilities in the Cook Islands, like that 6% of people in the Cook Islands have a disability.

Copy of Physical Challenges 2021 Census (003).xlsx
Research Summaries
Simple summaries of studies on disabilities and needs in the Cook Islands. This is still to come – perhaps utilise mataiti video, elijah’s citv video, disability action footage etc